Your program is now downloading
This may take a few seconds!
Related PowerPoint Templates
Free download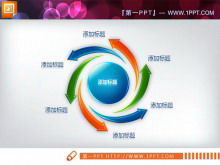
Exquisite center diffusion relationship PowerPoint chart material
Exquisite center diffusion relationship PowerPoint chart material
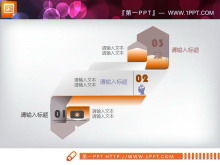
Fifteen elegant gray flat PPT charts package download
Fifteen elegant gray flat PPT charts package download

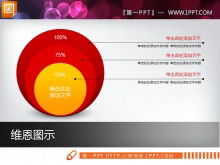
Three-color three-dimensional PPT relationship diagram package download
Three-color three-dimensional PPT relationship diagram package downl...

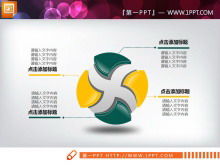
A PPT chart with a micro-stereoscopic circular parallel combination relationship with an icon
A PPT chart with a micro-stereoscopic circular parallel combination ...