Sci palettes for matplotlib/seaborn

Overview

sci palettes for matplotlib/seaborn

Installation

python3 -m pip install sci-palettes

Usage

import seaborn as sns
import matplotlib.pyplot as plt
import sci_palettes


print(sci_palettes.PALETTES.keys())

sci_palettes.register_cmap()          # register all palettes
sci_palettes.register_cmap('aaas')    # register a special palette

# methods for setting palette
plt.set_cmap('aaas')
plt.style.use('aaas')
sns.set_theme(palette='aaas')
sns.set_palette('aaas')

sns.scatterplot(...)

# set palette when plotting
sns.scatterplot(..., palette='aaas')

Full examples in examples
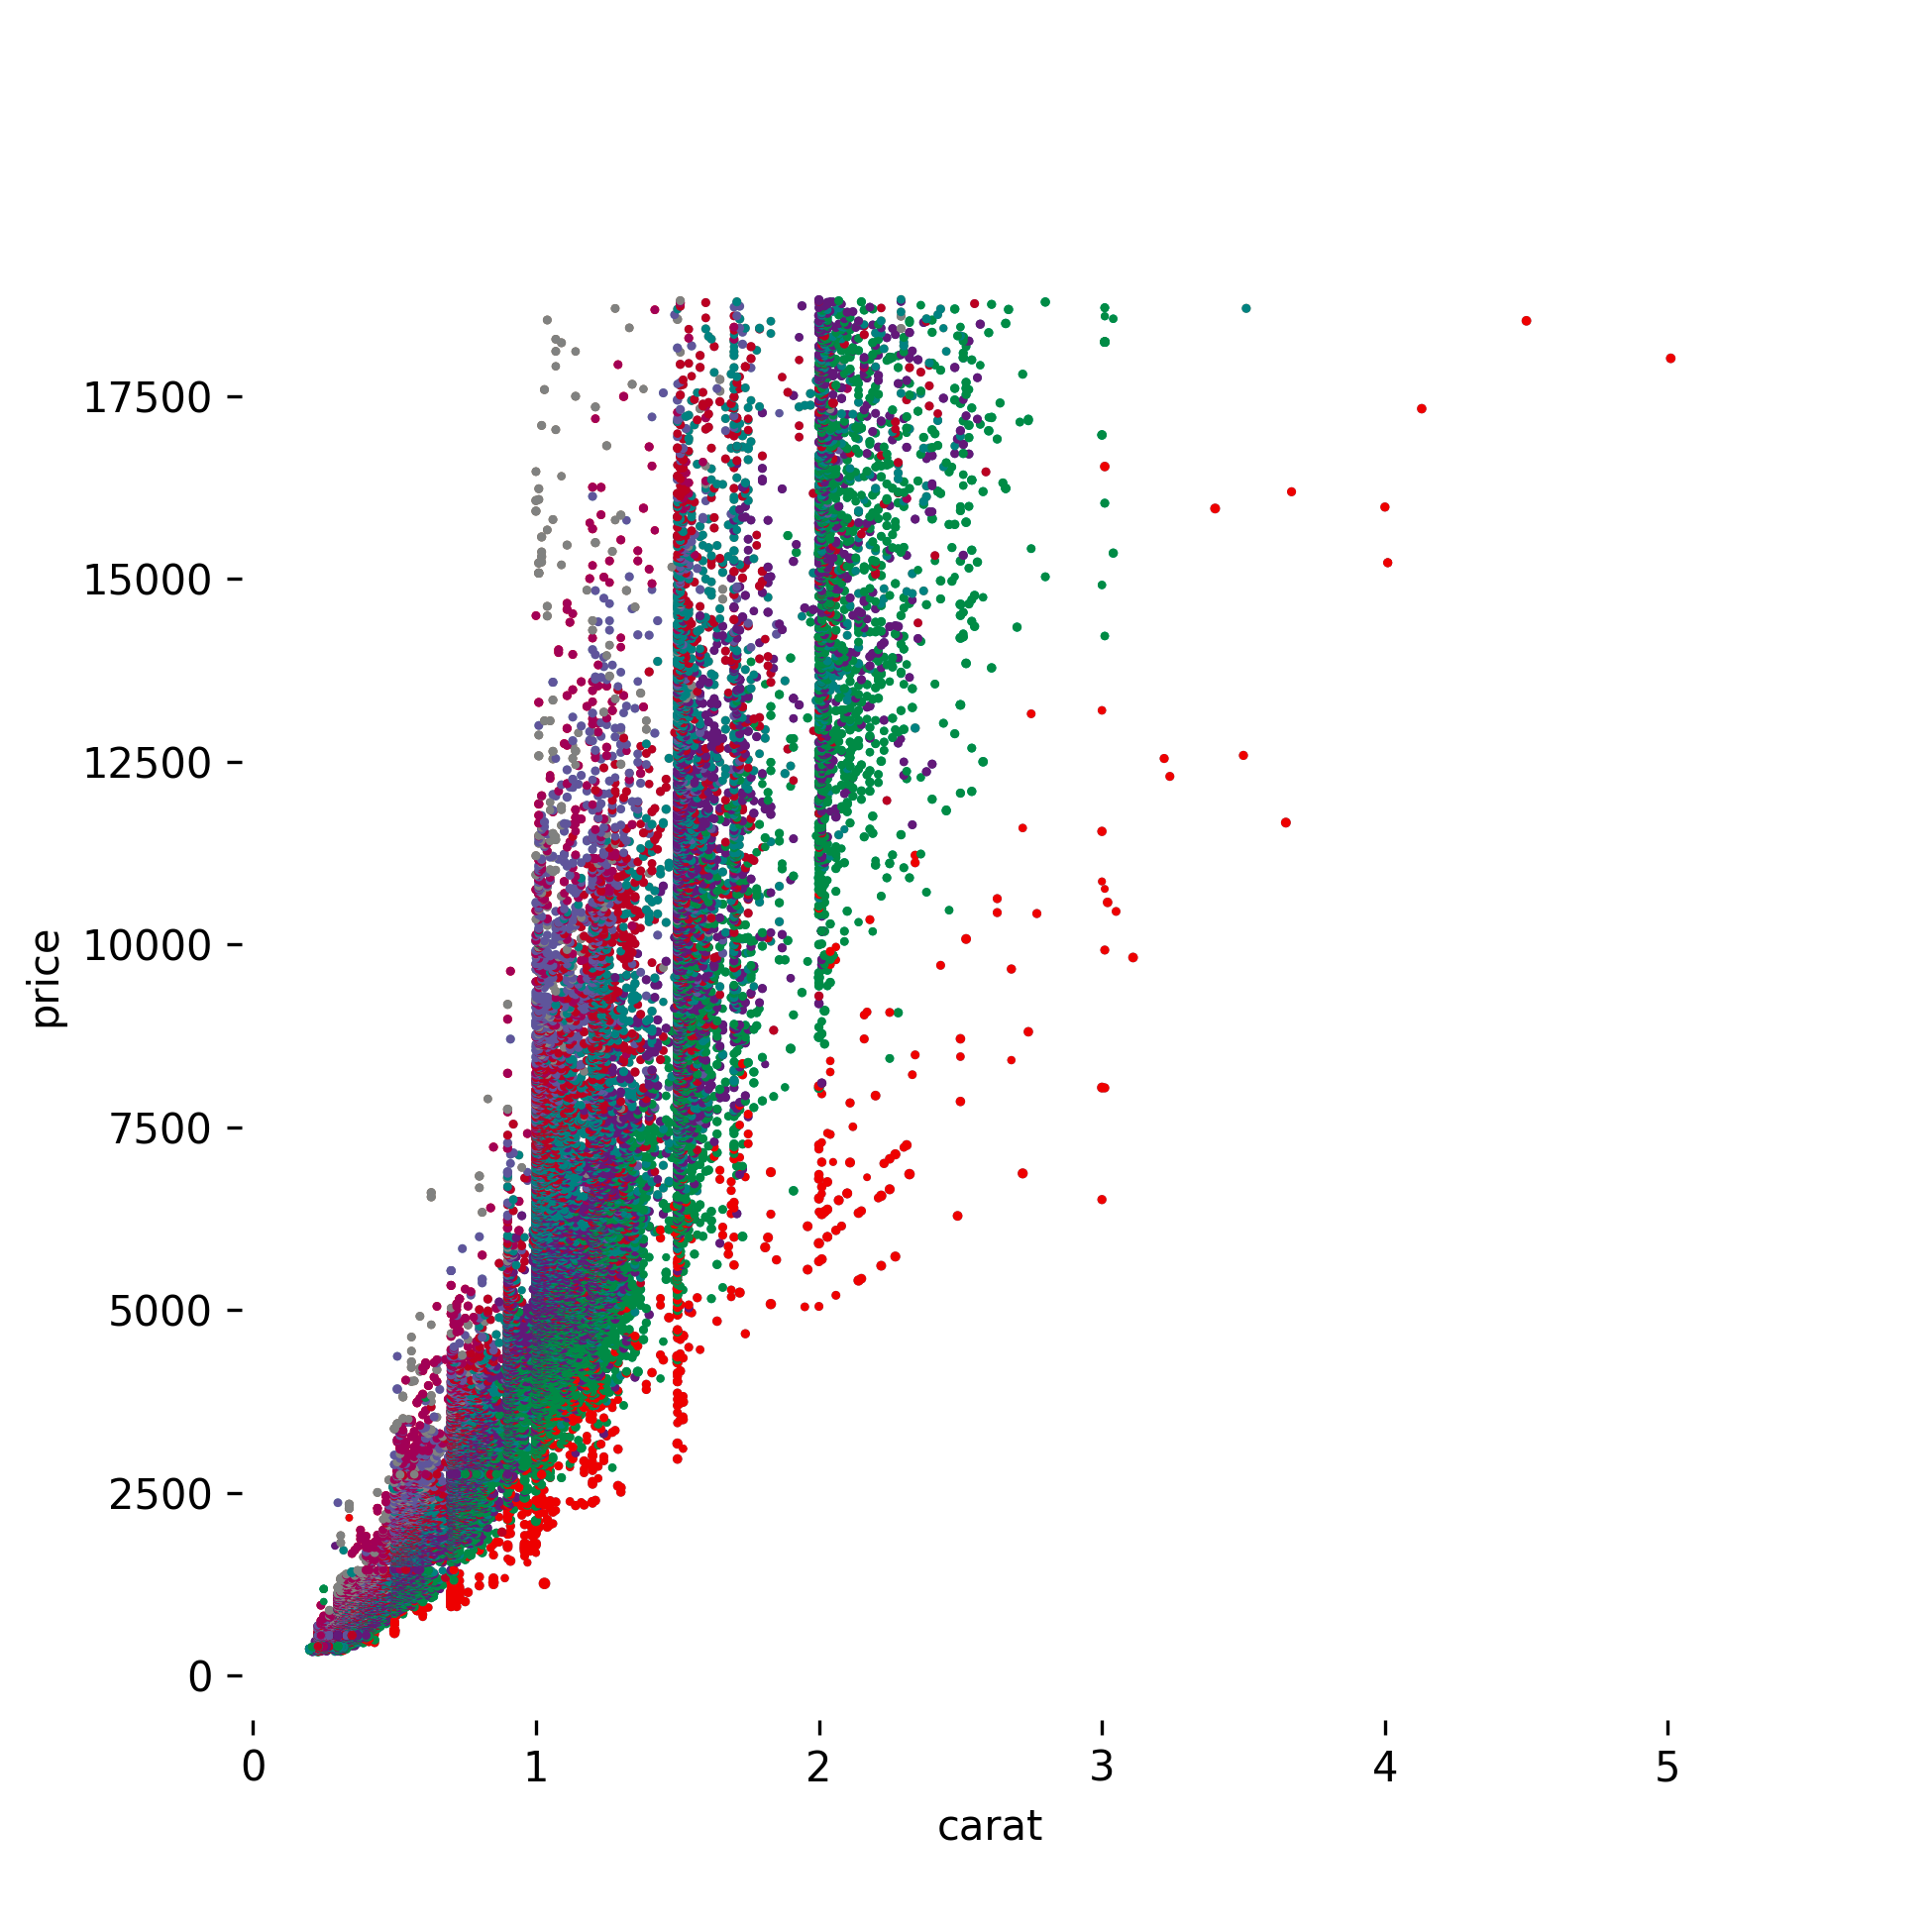
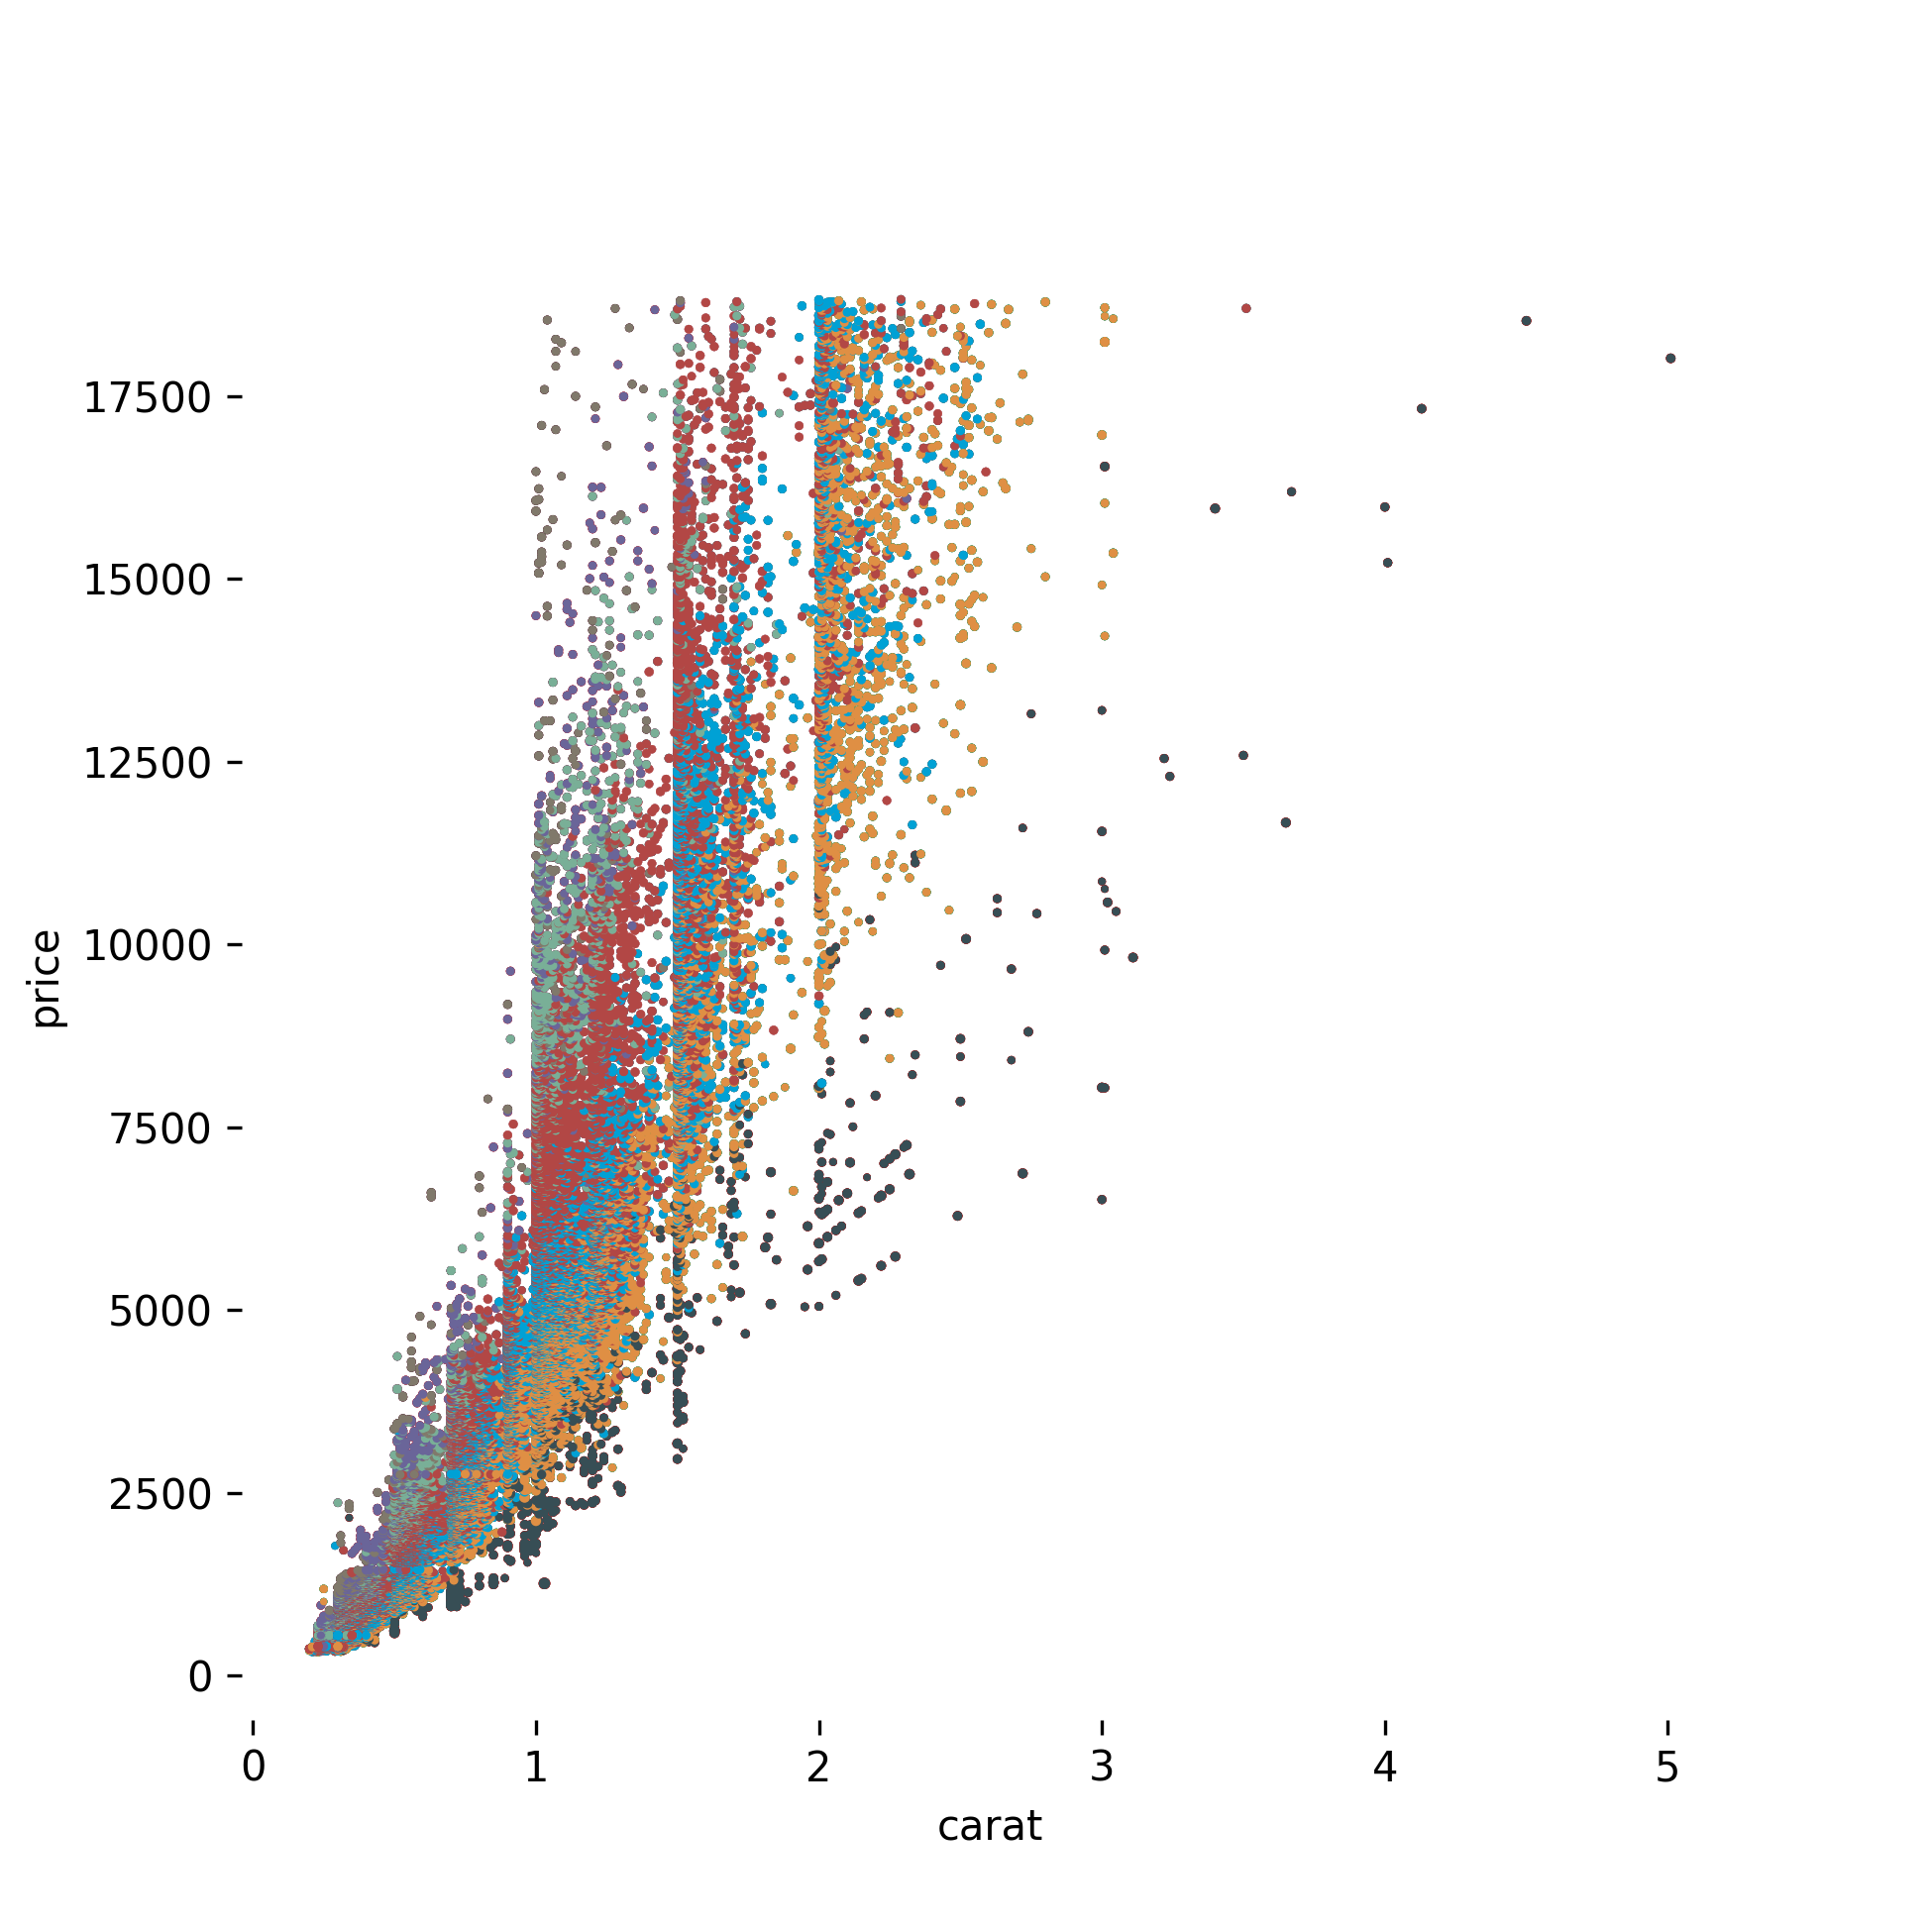
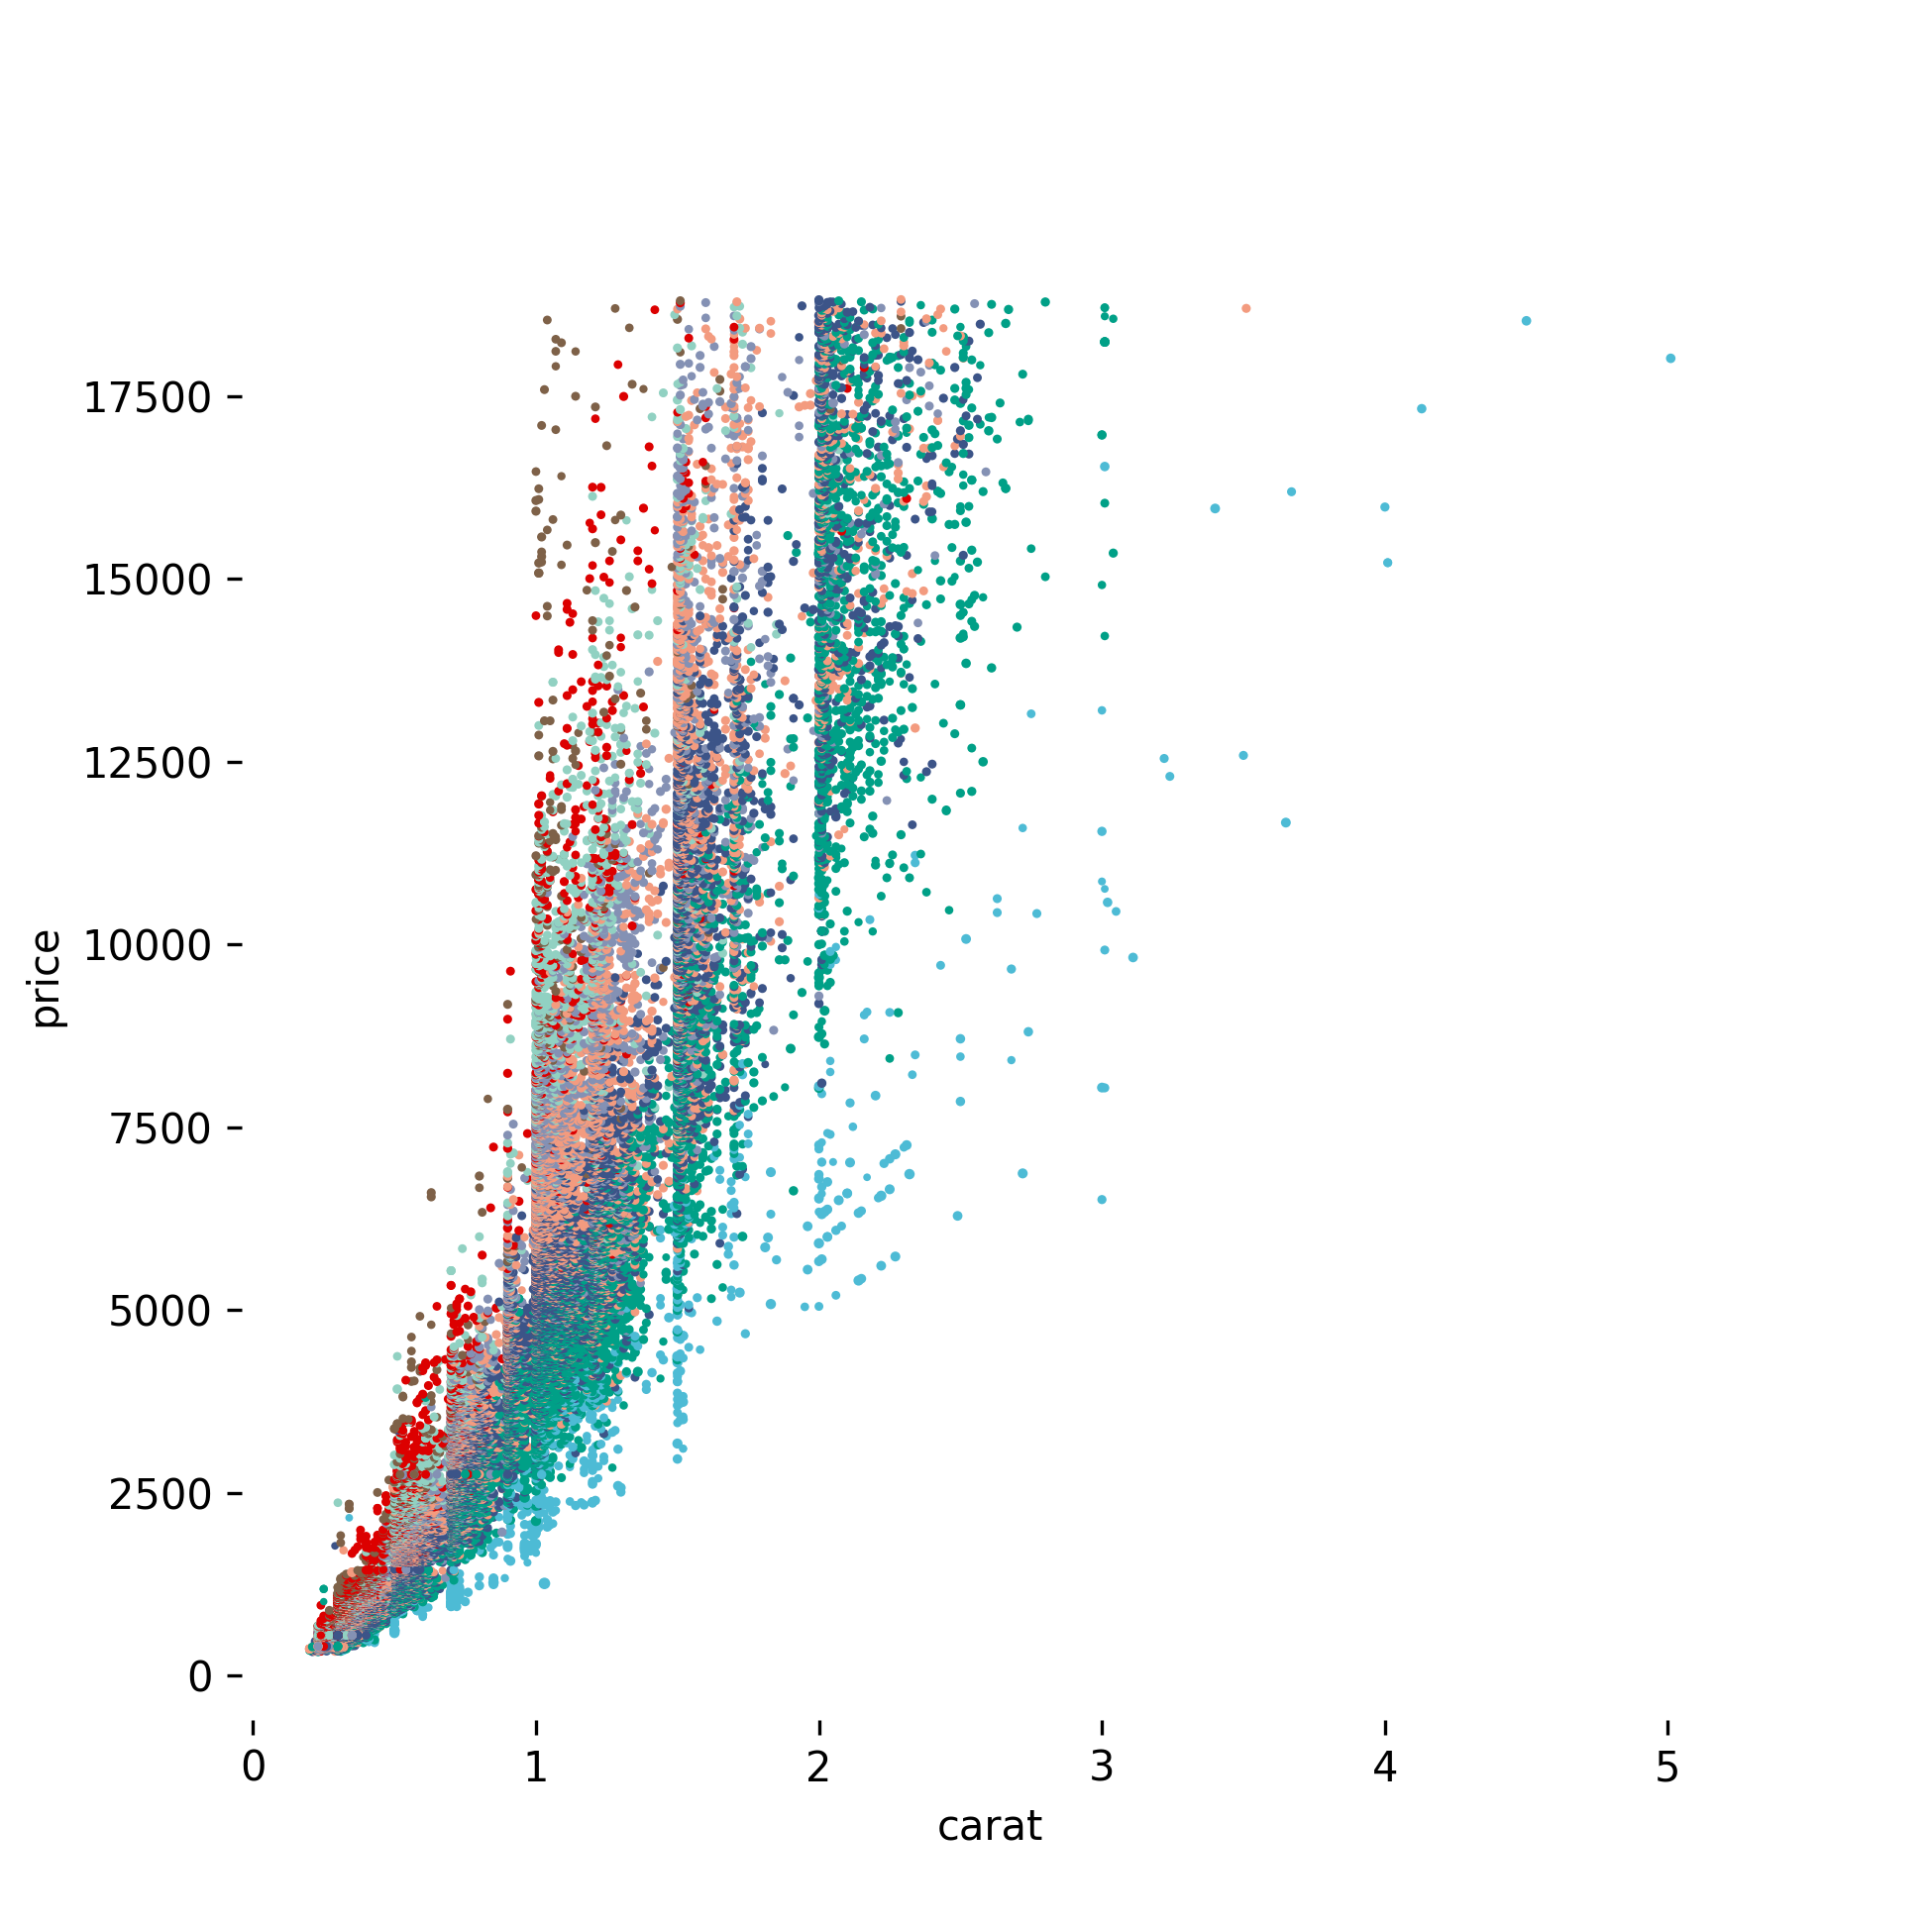
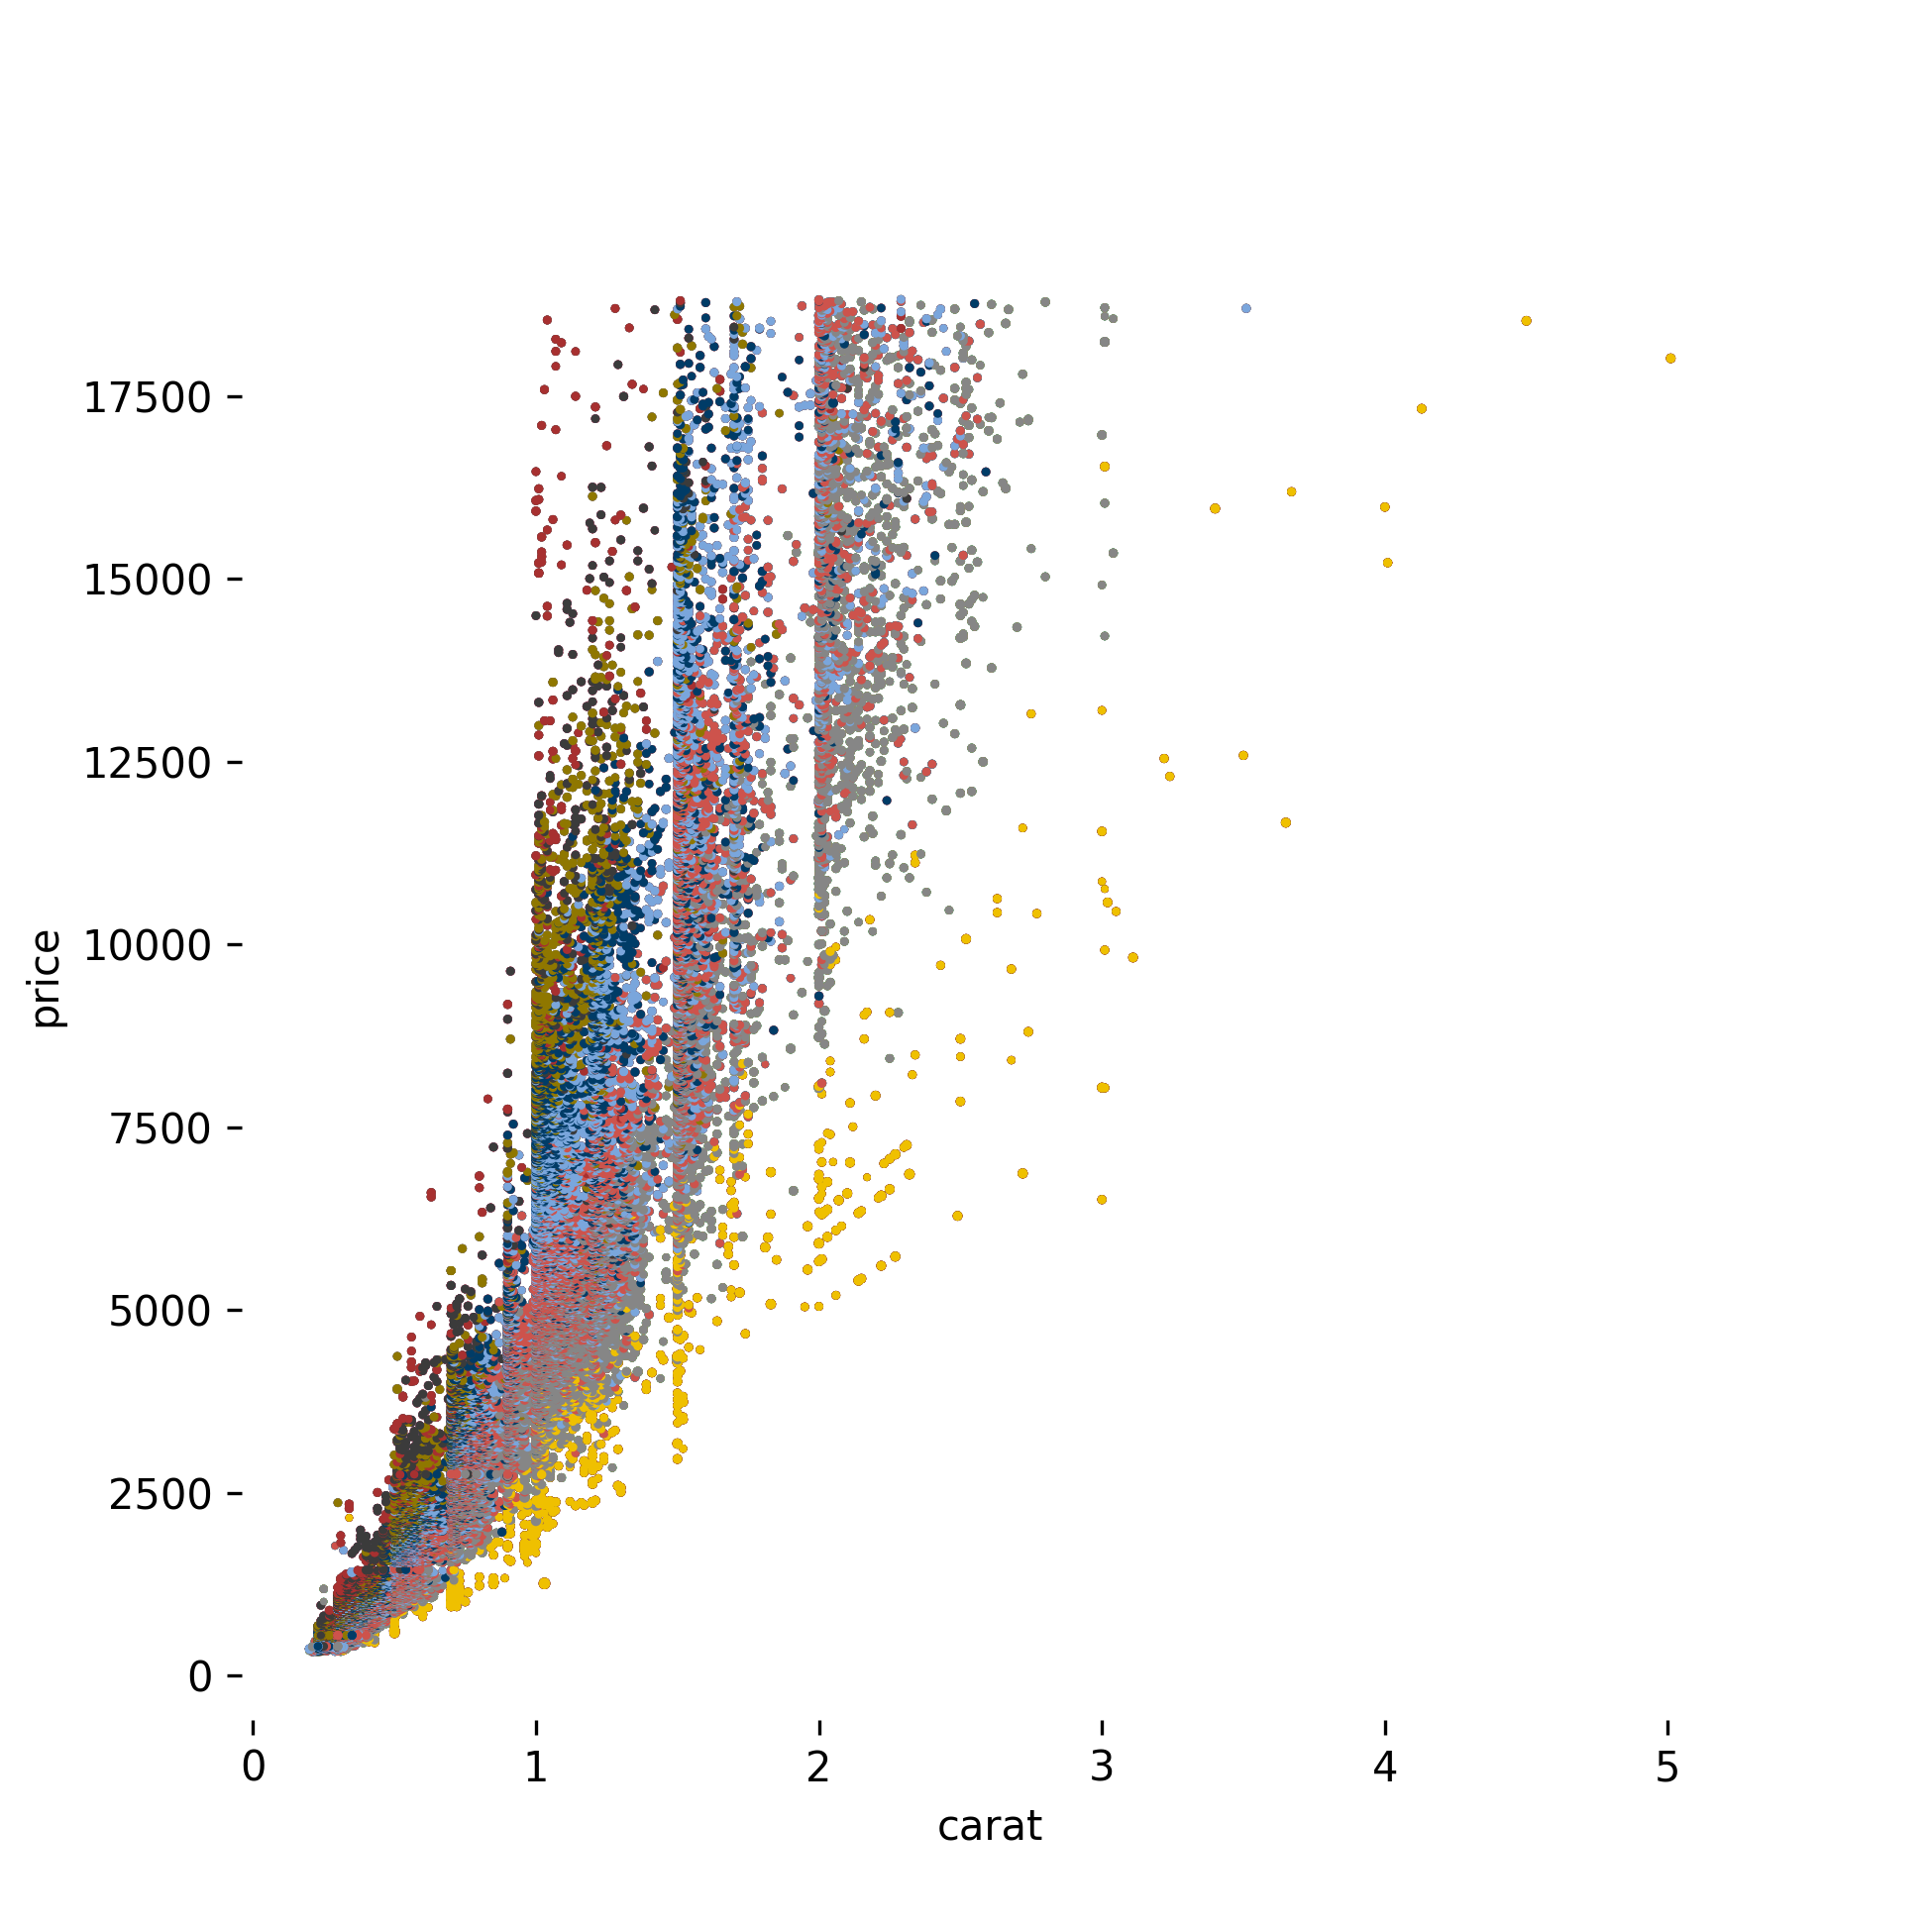
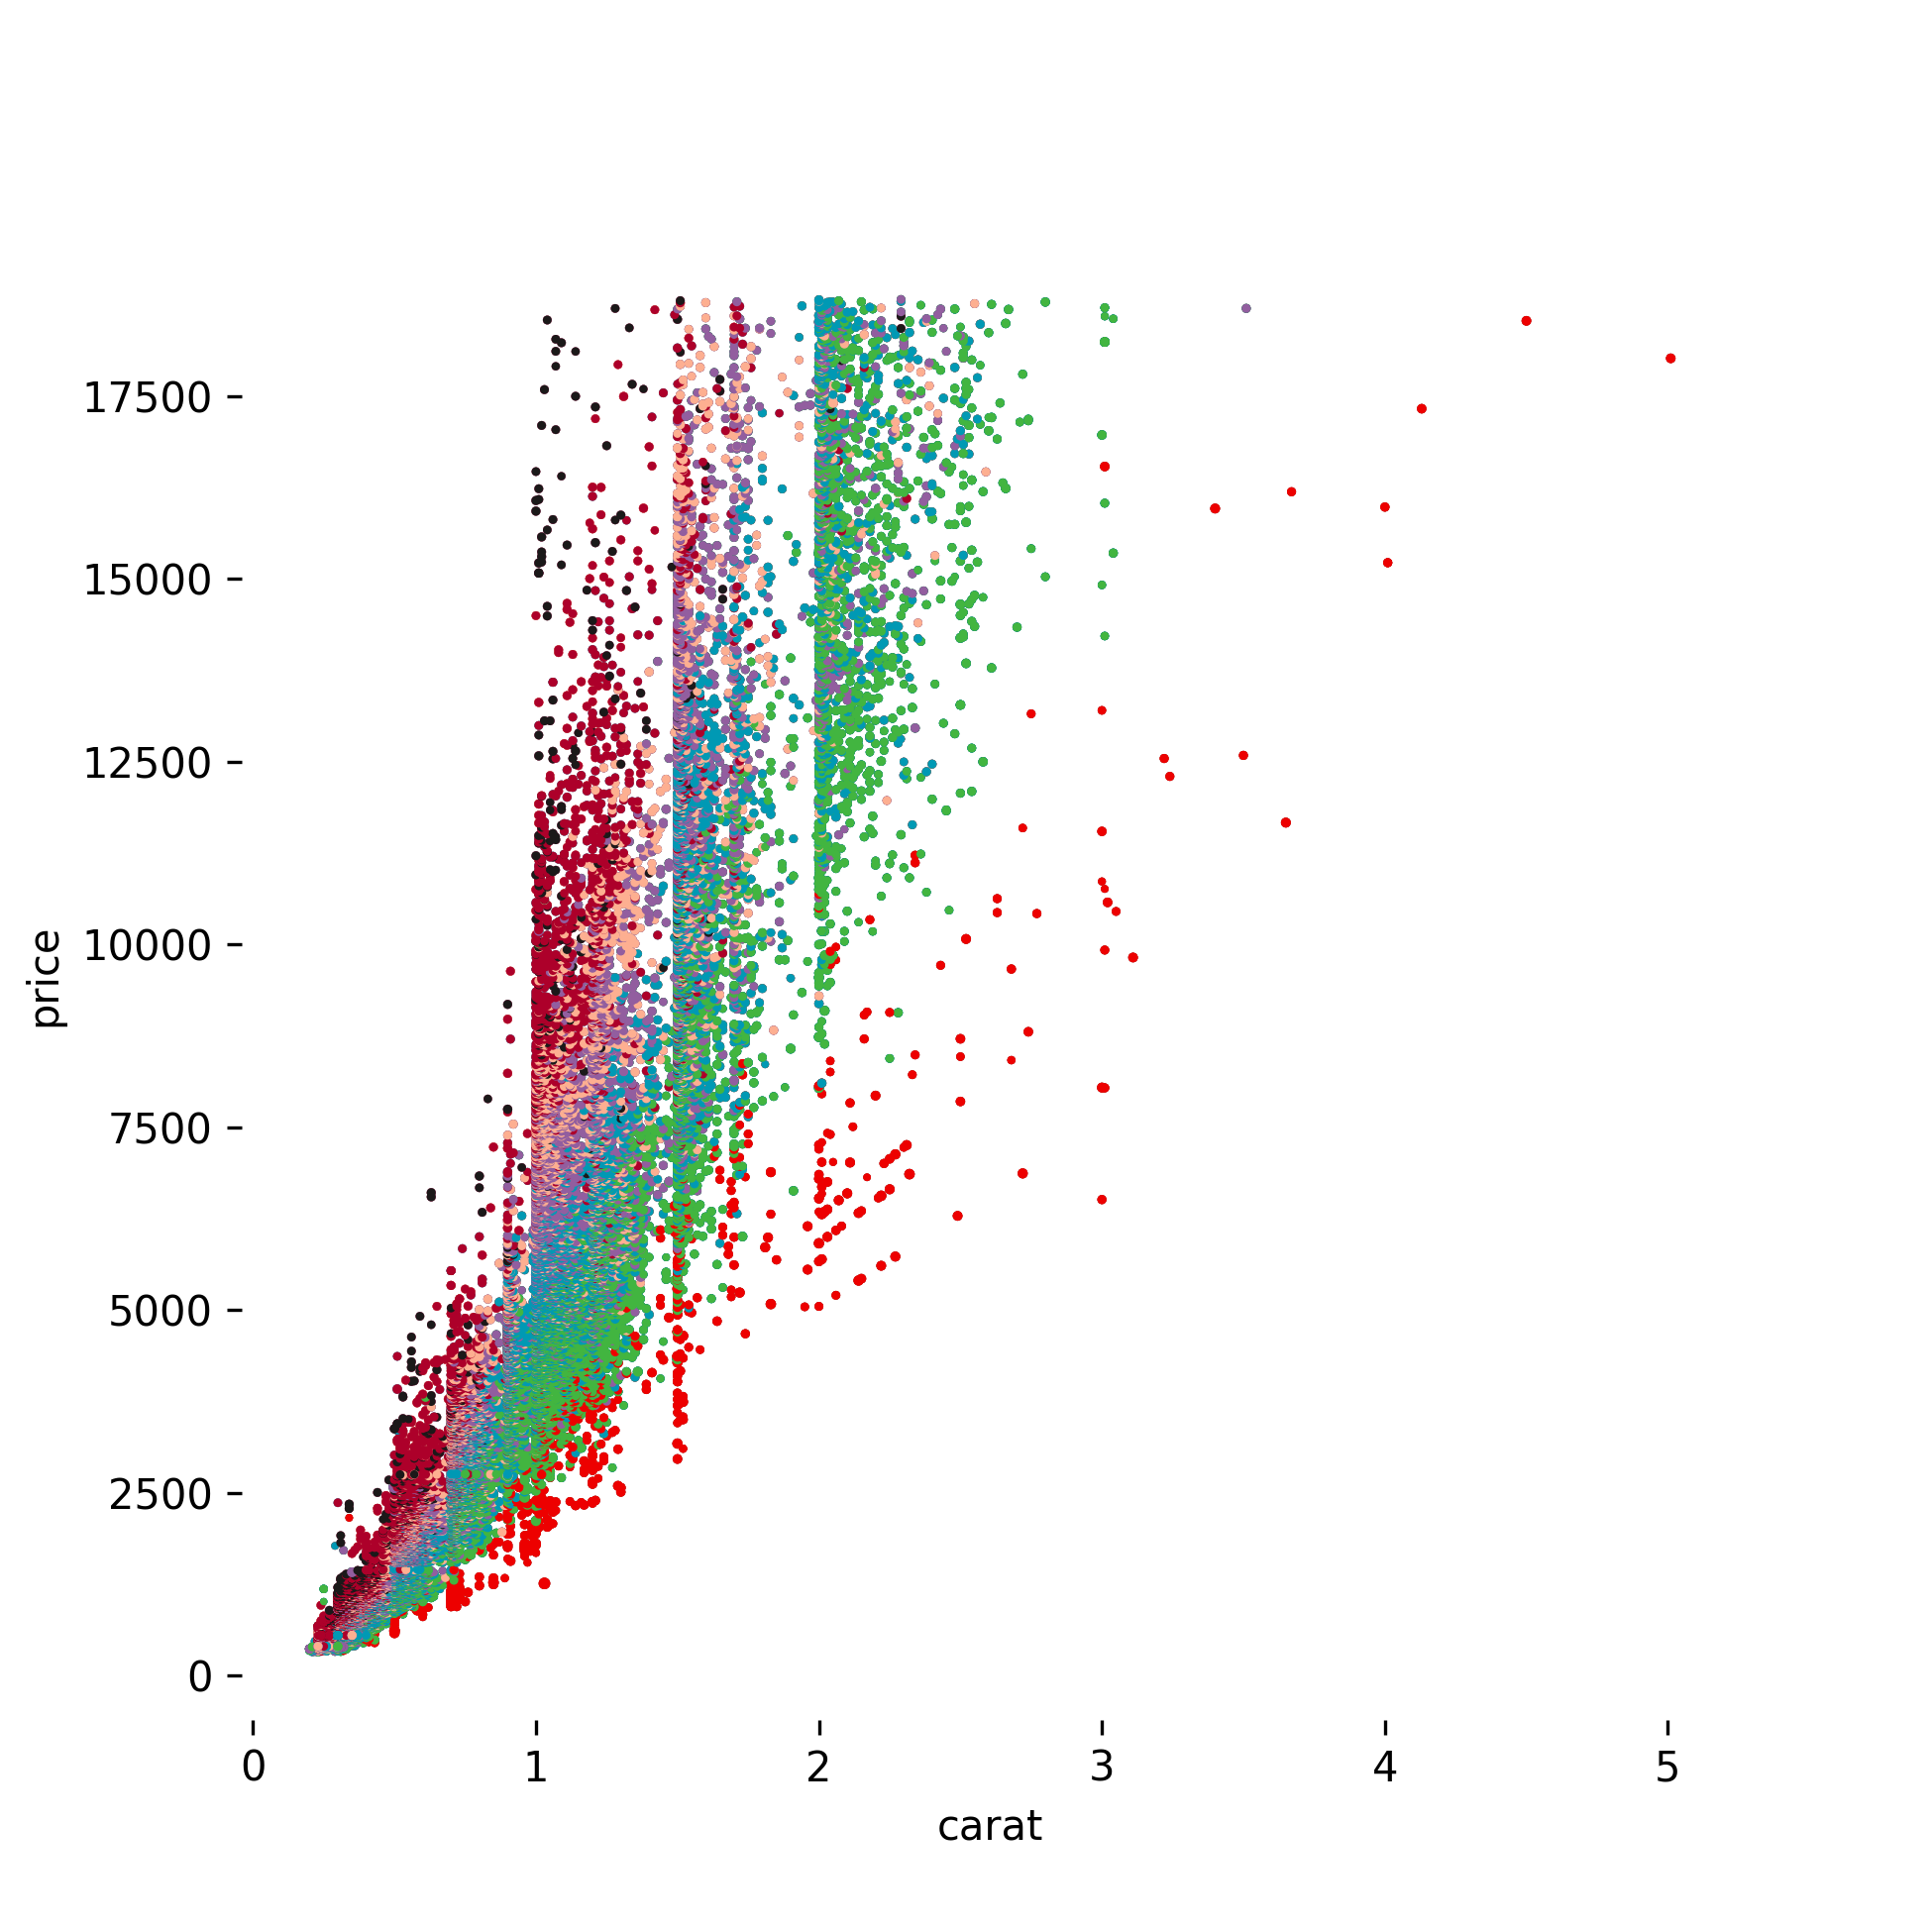
Gallery

展开查看

AAAS

JAMA

NPG

JCO

LANCET

Inspired by the R Package ggsci

Owner
Qingdong Su
Love Python, Love Programming, Love Life.
Qingdong Su
Implementation of SOMs (Self-Organizing Maps) with neighborhood-based map topologies.

py-self-organizing-maps Simple implementation of self-organizing maps (SOMs) A SOM is an unsupervised method for learning a mapping from a discrete ne

Jonas Grebe 6 Nov 22, 2022
CLAHE Contrast Limited Adaptive Histogram Equalization

A simple code to process images using contrast limited adaptive histogram equalization. Image processing is becoming a major part of data processig.

Happy N. Monday 4 May 18, 2022
A curated list of awesome Dash (plotly) resources

Awesome Dash A curated list of awesome Dash (plotly) resources Dash is a productive Python framework for building web applications. Written on top of

Luke Singham 1.7k Dec 26, 2022
An open-source tool for visual and modular block programing in python

PyFlow PyFlow is an open-source tool for modular visual programing in python ! Although for now the tool is in Beta and features are coming in bit by

1.1k Jan 06, 2023
Analysis and plotting for motor/prop/ESC characterization, thrust vs RPM and torque vs thrust

esc_test This is a Python package used to plot and analyze data collected for the purpose of characterizing a particular propeller, motor, and ESC con

Alex Spitzer 1 Dec 28, 2021
The Metabolomics Integrator (MINT) is a post-processing tool for liquid chromatography-mass spectrometry (LCMS) based metabolomics.

MINT (Metabolomics Integrator) The Metabolomics Integrator (MINT) is a post-processing tool for liquid chromatography-mass spectrometry (LCMS) based m

Sören Wacker 0 May 04, 2022
Attractors is a package for simulation and visualization of strange attractors.

attractors Attractors is a package for simulation and visualization of strange attractors. Installation The simplest way to install the module is via

Vignesh M 45 Jul 31, 2022
🎨 Python Echarts Plotting Library

pyecharts Python ❤️ ECharts = pyecharts English README 📣 简介 Apache ECharts (incubating) 是一个由百度开源的数据可视化,凭借着良好的交互性,精巧的图表设计,得到了众多开发者的认可。而 Python 是一门富有表达

pyecharts 13.1k Jan 03, 2023
paintable GitHub contribute table

githeart paintable github contribute table how to use: Functions key color select 1,2,3,4,5 clear c drawing mode mode on turn off e print paint matrix

Bahadır Araz 27 Nov 24, 2022
Learning Convolutional Neural Networks with Interactive Visualization.

CNN Explainer An interactive visualization system designed to help non-experts learn about Convolutional Neural Networks (CNNs) For more information,

Polo Club of Data Science 6.3k Jan 01, 2023
Draw datasets from within Jupyter.

drawdata This small python app allows you to draw a dataset in a jupyter notebook. This should be very useful when teaching machine learning algorithm

vincent d warmerdam 505 Nov 27, 2022
Area-weighted venn-diagrams for Python/matplotlib

Venn diagram plotting routines for Python/Matplotlib Routines for plotting area-weighted two- and three-circle venn diagrams. Installation The simples

Konstantin Tretyakov 400 Dec 31, 2022
erdantic is a simple tool for drawing entity relationship diagrams (ERDs) for Python data model classes

erdantic is a simple tool for drawing entity relationship diagrams (ERDs) for Python data model classes. Diagrams are rendered using the venerable Graphviz library.

DrivenData 129 Jan 04, 2023
Streamlit dashboard examples - Twitter cashtags, StockTwits, WSB, Charts, SQL Pattern Scanner

streamlit-dashboards Streamlit dashboard examples - Twitter cashtags, StockTwits, WSB, Charts, SQL Pattern Scanner Tutorial Video https://ww

122 Dec 21, 2022
SummVis is an interactive visualization tool for text summarization.

SummVis is an interactive visualization tool for analyzing abstractive summarization model outputs and datasets.

Robustness Gym 246 Dec 08, 2022
Sparkling Pandas

SparklingPandas SparklingPandas aims to make it easy to use the distributed computing power of PySpark to scale your data analysis with Pandas. Sparkl

366 Oct 27, 2022
Gallery of applications built using bqplot and widget libraries like ipywidgets, ipydatagrid etc.

bqplot Gallery This is a gallery of bqplot examples. View the gallery at https://bqplot.github.io/bqplot-gallery. Contributing new examples Clone this

8 Aug 23, 2022
Function Plotter: a simple application with GUI to plot mathematical functions

Function-Plotter Function Plotter is a simple application with GUI to plot mathe

Mohamed Nabawe 4 Jan 03, 2022
Fast visualization of radar_scenes based on oleschum/radar_scenes

RadarScenes Tools About This python package provides fast visualization for the RadarScenes dataset. The Open GL based visualizer is smoother than ole

Henrik Söderlund 2 Dec 09, 2021
Draw tree diagrams from indented text input

Draw tree diagrams This repository contains two very different scripts to produce hierarchical tree diagrams like this one: $ ./classtree.py collectio

Luciano Ramalho 8 Dec 14, 2022